Cryptocurrencies Energy Consumption Visualization(CECV)
CECV demo has been deployed on Heroku. The Demo link is here
What is CECV?
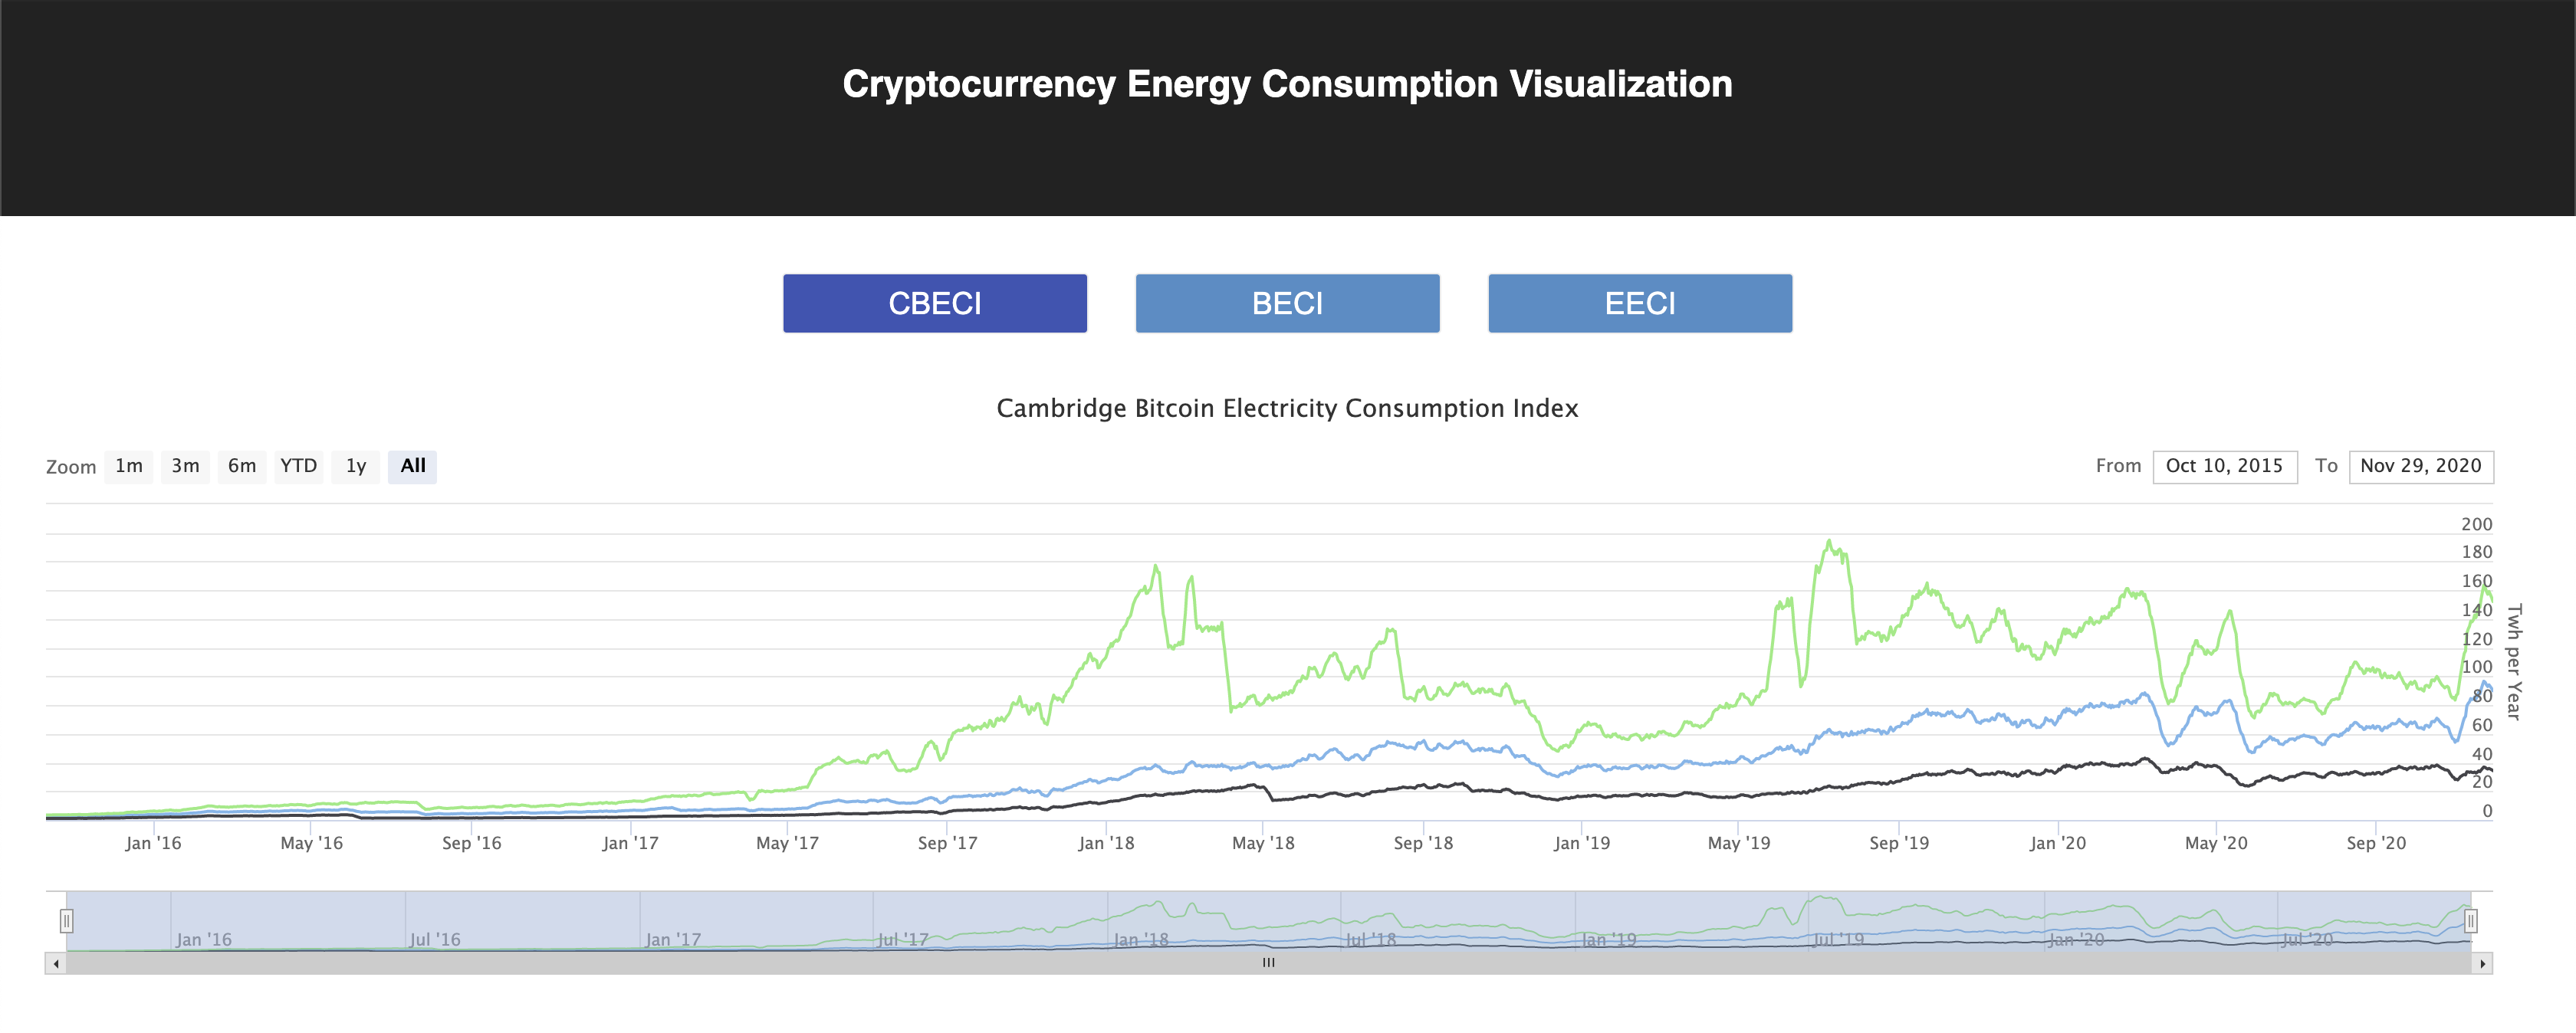
CECV is a web application to convert cryptocurrency energy consumption data into graphs and present them in a intuitive and interactive way. In CECV, we present two data sets including the BECI (Bitcoin Energy Consumption Index) and EECI (Ethereum Energy Consumption Index).
According to the BECI from Digiconomist, the peak value of the annual electricity consumption reached 77.782TWh, which is comparable to the power consumption of Chile. Besides, the generated annual carbon footprint is nearly 36.95 Mt of carbon dioxide, comparable to the carbon footprint of New Zealand. Moreover, the electricity consumption of a single transaction is 761.93 kWh, which is close to the energy consumption of 700,000 VISA payments and is equivalent to the 20-day average electricity consumption of American households, and the e-waste generated by each transaction is 101.10 grams.
As for the EECI, the annual total electrical energy consumption of Ethereum is 11.89 TWh, which is comparable to the power consumption of Uruguay, and the footprint per single transaction is 29.44 kWh, equivalent to the power consumption of an average U.S. household over 0.99 days.
How to run CECV?
Download and Install the latest version of NodeJS
The NodeJs official download link is here
Download the latest version of CECV
1
$ git clone https://github.com/ChenHuangyin/CECV.git
Get into the git repository folder and install the application dependencies
1
$ npm install
Run the application locally
1
$ npm start
How is CECV built?
ReactJs (User Interface)
Lodash (JavaScript Utility Library)
HighCharts (Data Visualization)
D3 (Data Visualization)
Python3 (Data Processing and Analysis)
Digiconomist (Data Source)
